(m <- matrix(1:12, nrow = 3, ncol = 4)) [,1] [,2] [,3] [,4]
[1,] 1 4 7 10
[2,] 2 5 8 11
[3,] 3 6 9 12In R, matrices are ordered row-wise:
(m <- matrix(1:12, nrow = 3, ncol = 4)) [,1] [,2] [,3] [,4]
[1,] 1 4 7 10
[2,] 2 5 8 11
[3,] 3 6 9 12The image() function presents this as the transpose of what we see printed.
m[] <- 0
m[2, 1] <- -10
m[3, 2] <- 30
m
[,1] [,2] [,3] [,4]
[1,] 0 0 0 0
[2,] -10 0 0 0
[3,] 0 30 0 0t(m[, ncol(m):1]) [,1] [,2] [,3]
[1,] 0 0 0
[2,] 0 0 0
[3,] 0 0 30
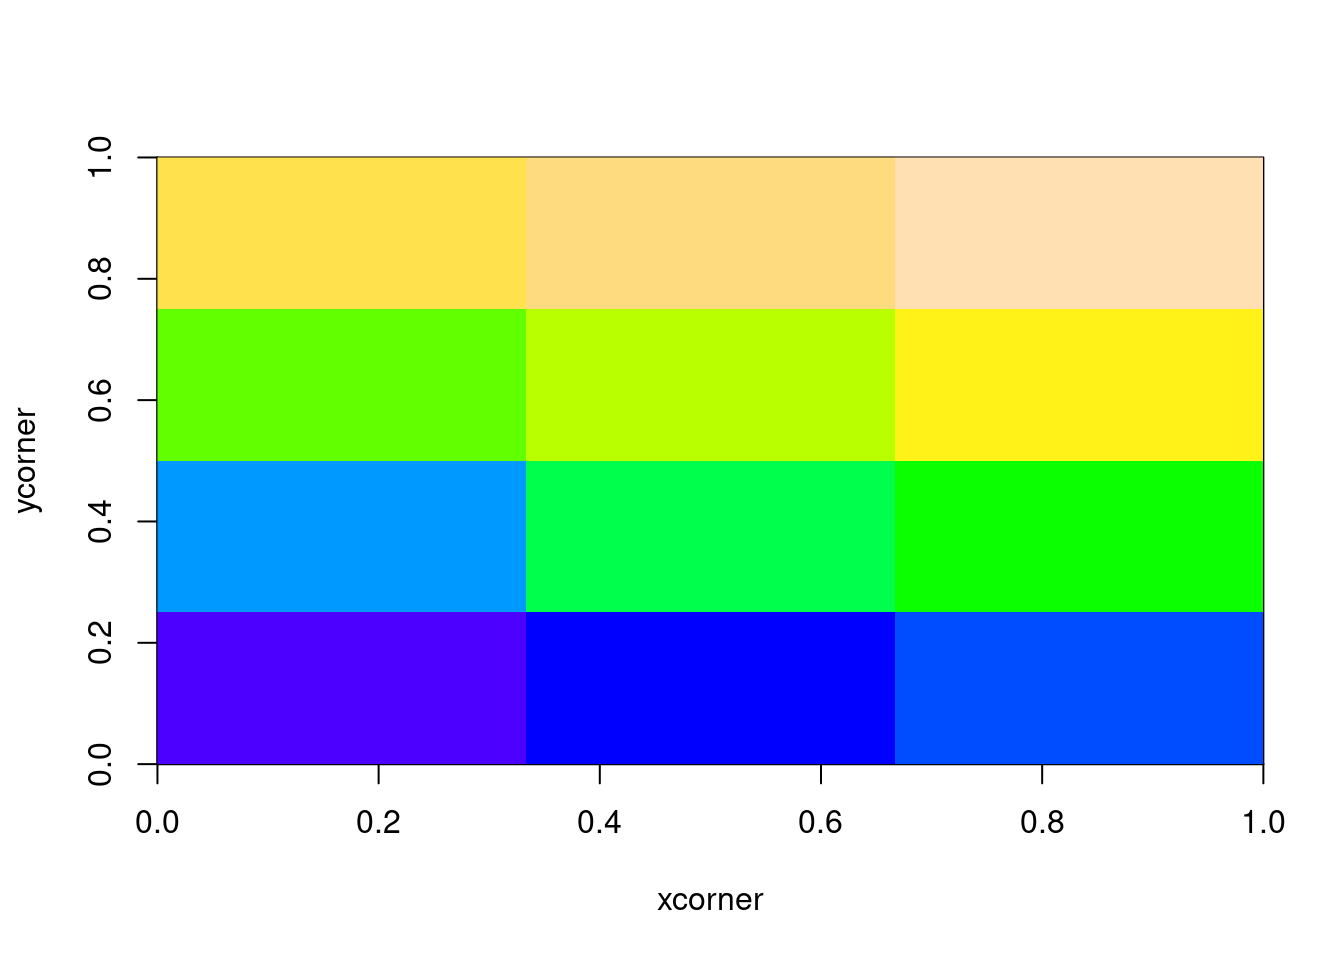
[4,] 0 -10 0… Notice that image interprets the z matrix as a table of f(x[i], y[j]) values, so that the x axis corresponds to row number and the y axis to column number, with column 1 at the bottom, i.e. a 90 degree counter-clockwise rotation of the conventional printed layout of a matrix. …
image(m)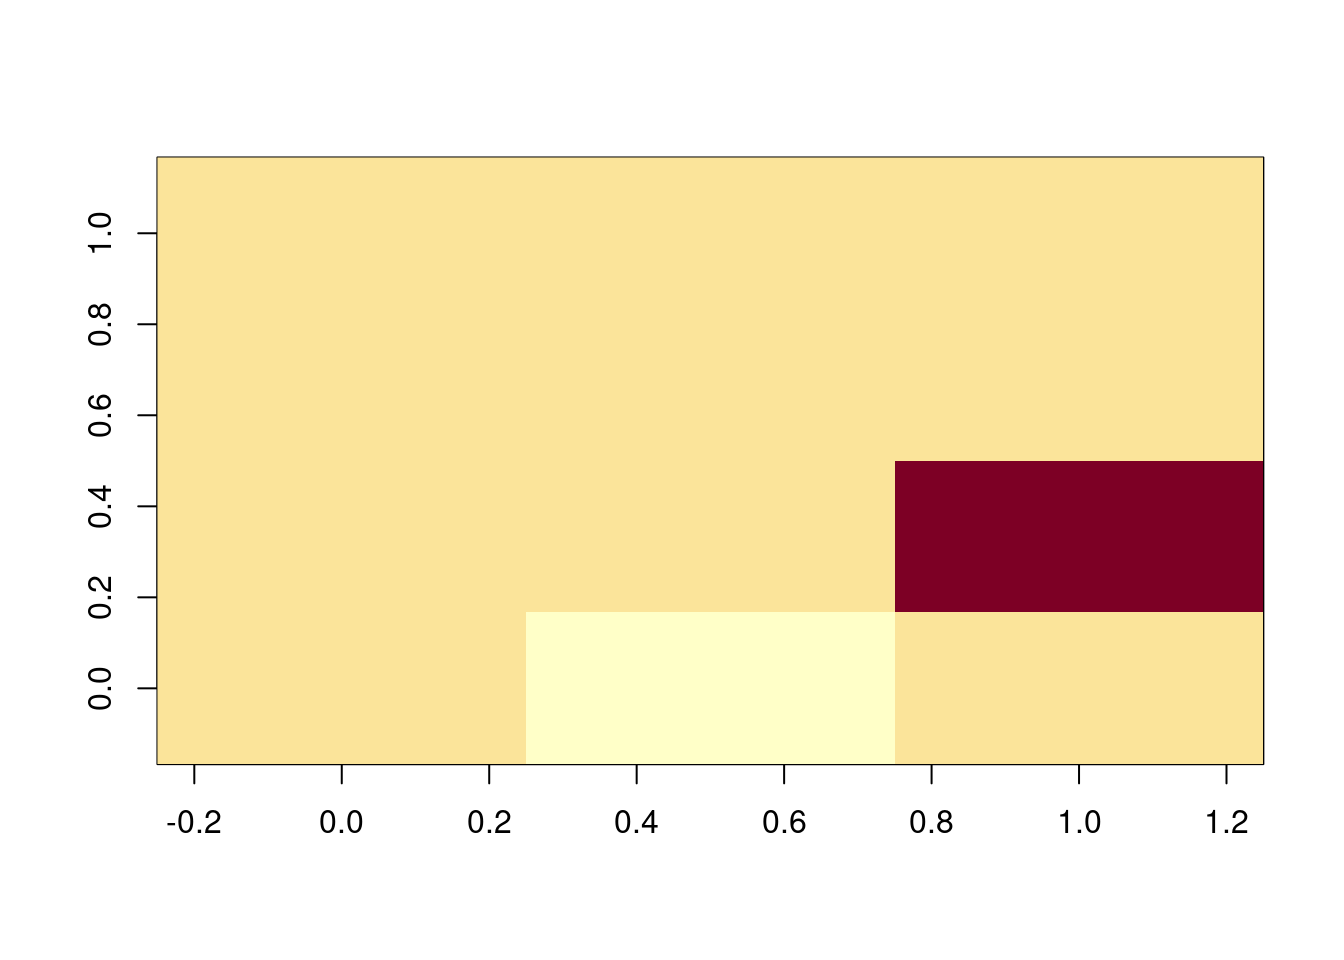
This is fairly obvious, each cell is painted as a discrete block with cell centres evenly spaced between 0 and 1.
m <- matrix(1:12, 3)
image(m)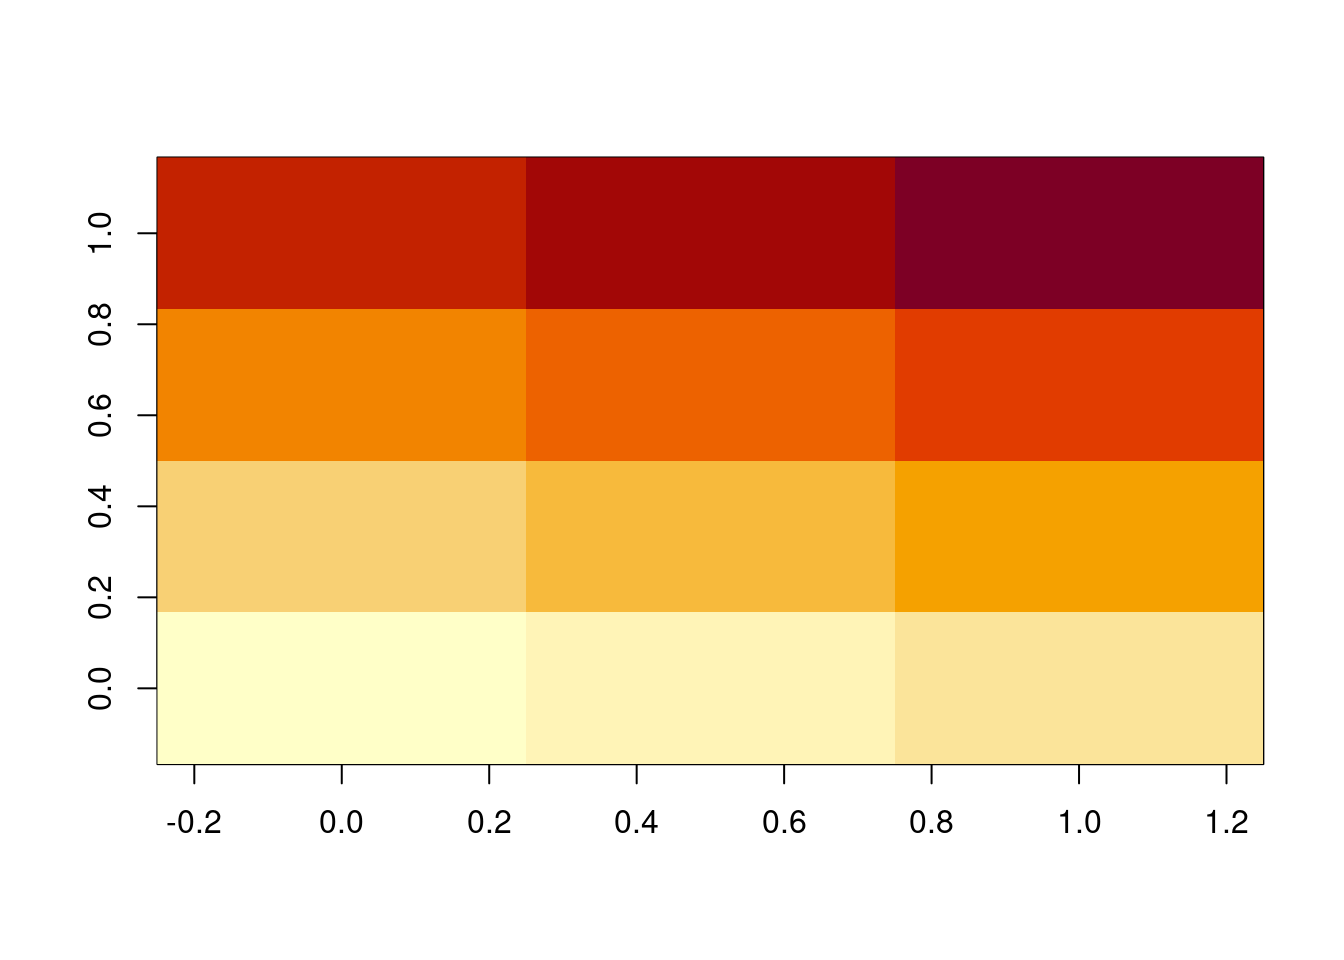
We didn’t give it any coordinates to position the image, so it made some up.
image(m, main = "input coordinates are cell centres")
xx <- seq.int(0, 1, length.out = nrow(m))
yy <- seq.int(0, 1, length.out = ncol(m))
abline(h = yy, v = xx, lty = 2)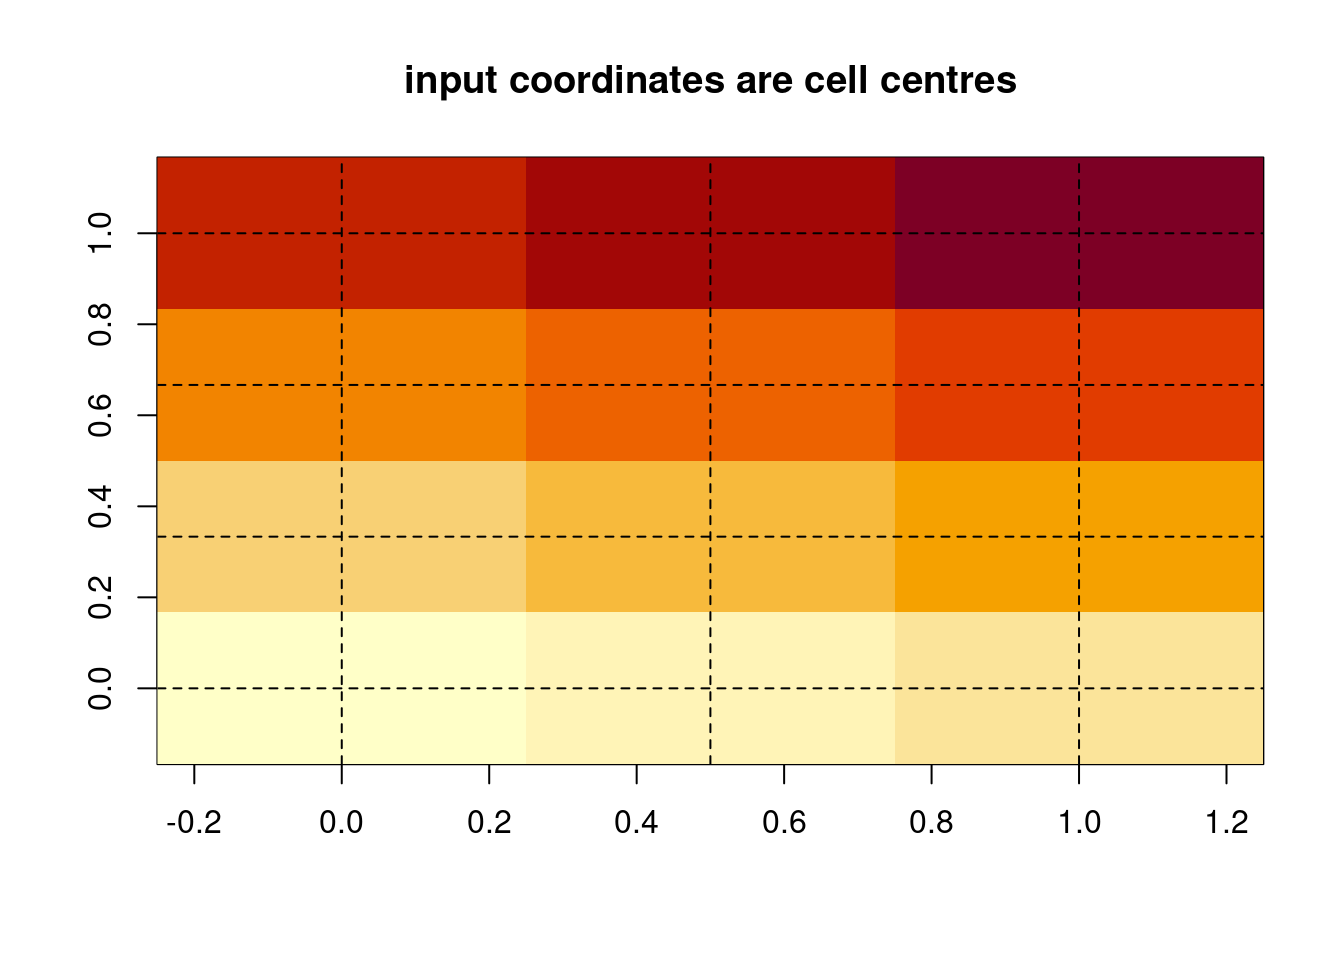
This lends itself to a convenient data structure.
dat <- list(x = xx, y = yy, z = m)
image(dat)
text(expand.grid(xx, yy), lab = as.vector(m))
## points(expand.grid(xx, yy))The function image() has some hidden tricks.
xcorner <- seq.int(0, 1, length.out = nrow(m) + 1L)
ycorner <- seq.int(0, 1, length.out = ncol(m) + 1L)
print(xcorner)
[1] 0.0000000 0.3333333 0.6666667 1.0000000print(ycorner)[1] 0.00 0.25 0.50 0.75 1.00## [1] 0.00 0.25 0.50 0.75 1.00image(xcorner, ycorner, m, main = "input coordinates are cell corners")
abline(h = ycorner, v = xcorner)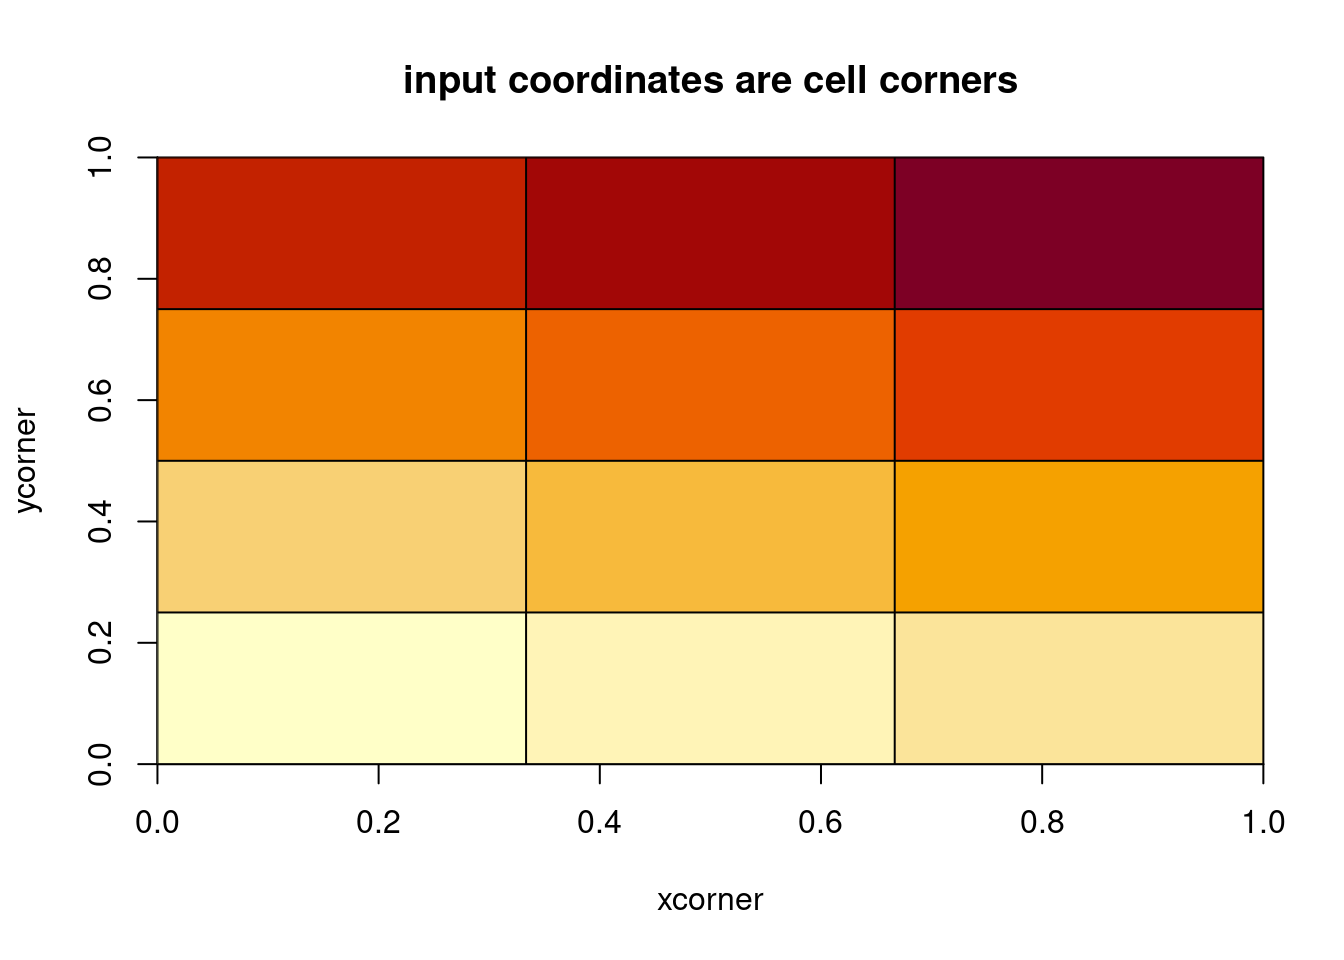
We can even use non-regular coordinates.
ycorner <- 1.5^seq_along(ycorner)
image(xcorner, ycorner, m)
abline(h = ycorner, v = xcorner)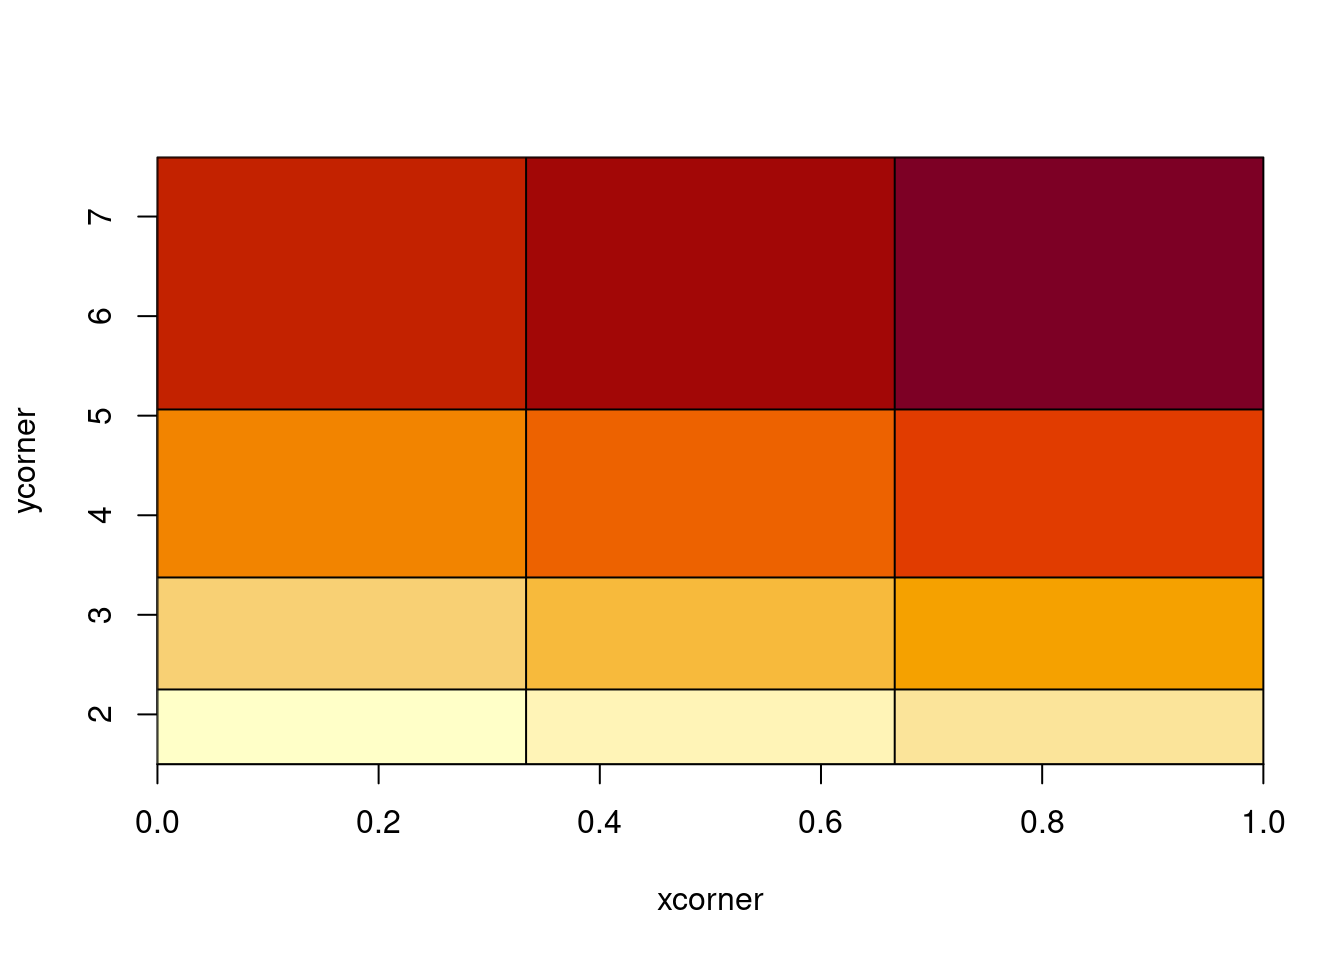
print(image.default)function (x = seq(0, 1, length.out = nrow(z)), y = seq(0, 1,
length.out = ncol(z)), z, zlim = range(z[is.finite(z)]),
xlim = range(x), ylim = range(y), col = hcl.colors(12, "YlOrRd",
rev = TRUE), add = FALSE, xaxs = "i", yaxs = "i", xlab,
ylab, breaks, oldstyle = FALSE, useRaster, ...)
{
if (missing(z)) {
if (!missing(x)) {
if (is.list(x)) {
z <- x$z
y <- x$y
x <- x$x
}
else {
if (is.null(dim(x)))
stop("argument must be matrix-like")
z <- x
x <- seq.int(0, 1, length.out = nrow(z))
}
if (missing(xlab))
xlab <- ""
if (missing(ylab))
ylab <- ""
}
else stop("no 'z' matrix specified")
}
else if (is.list(x)) {
xn <- deparse1(substitute(x))
if (missing(xlab))
xlab <- paste0(xn, "$x")
if (missing(ylab))
ylab <- paste0(xn, "$y")
y <- x$y
x <- x$x
}
else {
if (missing(xlab))
xlab <- if (missing(x))
""
else deparse1(substitute(x))
if (missing(ylab))
ylab <- if (missing(y))
""
else deparse1(substitute(y))
}
if (any(!is.finite(x)) || any(!is.finite(y)))
stop("'x' and 'y' values must be finite and non-missing")
if (any(diff(x) <= 0) || any(diff(y) <= 0))
stop("increasing 'x' and 'y' values expected")
if (!is.matrix(z))
stop("'z' must be a matrix")
if (!typeof(z) %in% c("logical", "integer", "double"))
stop("'z' must be numeric or logical")
if (length(x) > 1 && length(x) == nrow(z)) {
dx <- 0.5 * diff(x)
x <- c(x[1L] - dx[1L], x[-length(x)] + dx, x[length(x)] +
dx[length(x) - 1])
}
if (length(y) > 1 && length(y) == ncol(z)) {
dy <- 0.5 * diff(y)
y <- c(y[1L] - dy[1L], y[-length(y)] + dy, y[length(y)] +
dy[length(y) - 1L])
}
if (missing(breaks)) {
nc <- length(col)
if (!missing(zlim) && (any(!is.finite(zlim)) || diff(zlim) <
0))
stop("invalid z limits")
if (diff(zlim) == 0)
zlim <- if (zlim[1L] == 0)
c(-1, 1)
else zlim[1L] + c(-0.4, 0.4) * abs(zlim[1L])
z <- (z - zlim[1L])/diff(zlim)
zi <- if (oldstyle)
floor((nc - 1) * z + 0.5)
else floor((nc - 1e-05) * z + 1e-07)
zi[zi < 0 | zi >= nc] <- NA
}
else {
if (length(breaks) != length(col) + 1)
stop("must have one more break than colour")
if (any(!is.finite(breaks)))
stop("'breaks' must all be finite")
if (is.unsorted(breaks)) {
warning("unsorted 'breaks' will be sorted before use")
breaks <- sort(breaks)
}
zi <- .bincode(z, breaks, TRUE, TRUE) - 1L
}
if (!add)
plot(xlim, ylim, xlim = xlim, ylim = ylim, type = "n",
xaxs = xaxs, yaxs = yaxs, xlab = xlab, ylab = ylab,
...)
if (length(x) <= 1)
x <- par("usr")[1L:2]
if (length(y) <= 1)
y <- par("usr")[3:4]
if (length(x) != nrow(z) + 1 || length(y) != ncol(z) + 1)
stop("dimensions of z are not length(x)(-1) times length(y)(-1)")
check_irregular <- function(x, y) {
dx <- diff(x)
dy <- diff(y)
(length(dx) && !isTRUE(all.equal(dx, rep(dx[1], length(dx))))) ||
(length(dy) && !isTRUE(all.equal(dy, rep(dy[1], length(dy)))))
}
if (missing(useRaster)) {
useRaster <- getOption("preferRaster", FALSE)
if (useRaster && check_irregular(x, y))
useRaster <- FALSE
if (useRaster) {
useRaster <- FALSE
ras <- dev.capabilities("rasterImage")$rasterImage
if (identical(ras, "yes"))
useRaster <- TRUE
if (identical(ras, "non-missing"))
useRaster <- all(!is.na(zi))
}
}
if (useRaster) {
if (check_irregular(x, y))
stop(gettextf("%s can only be used with a regular grid",
sQuote("useRaster = TRUE")), domain = NA)
if (!is.character(col)) {
col <- as.integer(col)
if (any(!is.na(col) & col < 0L))
stop("integer colors must be non-negative")
col[col < 1L] <- NA_integer_
p <- palette()
col <- p[((col - 1L)%%length(p)) + 1L]
}
zc <- col[zi + 1L]
dim(zc) <- dim(z)
zc <- t(zc)[ncol(zc):1L, , drop = FALSE]
rasterImage(as.raster(zc), min(x), min(y), max(x), max(y),
interpolate = FALSE)
}
else .External.graphics(C_image, x, y, zi, col)
invisible()
}
<bytecode: 0x55b5b27527a8>
<environment: namespace:graphics>This is like looping with rect()
op <- par(mfrow = c(1, 2))
## life is hard
cols <- topo.colors(25)
scale <- round((m - min(m))/diff(range(m)) * (length(cols) - 1) + 1)
plot(NA, type = "n", xlim = range(xcorner), ylim = range(ycorner), asp = 1)
for (i in seq_along(xcorner[-1L])) {
    for (j in seq_along(ycorner[-1L])) {
        rect(xleft = xcorner[i], ybottom = ycorner[j], xright = xcorner[i +
            1L], ytop = ycorner[j + 1L], col = cols[scale[i, j]], angle = 45 *
            (i + j)%%2, density = 20, lwd = 2)
    }

}

## life is good
image(list(x = xcorner, y = ycorner, z = m), col = topo.colors(25), asp = 1)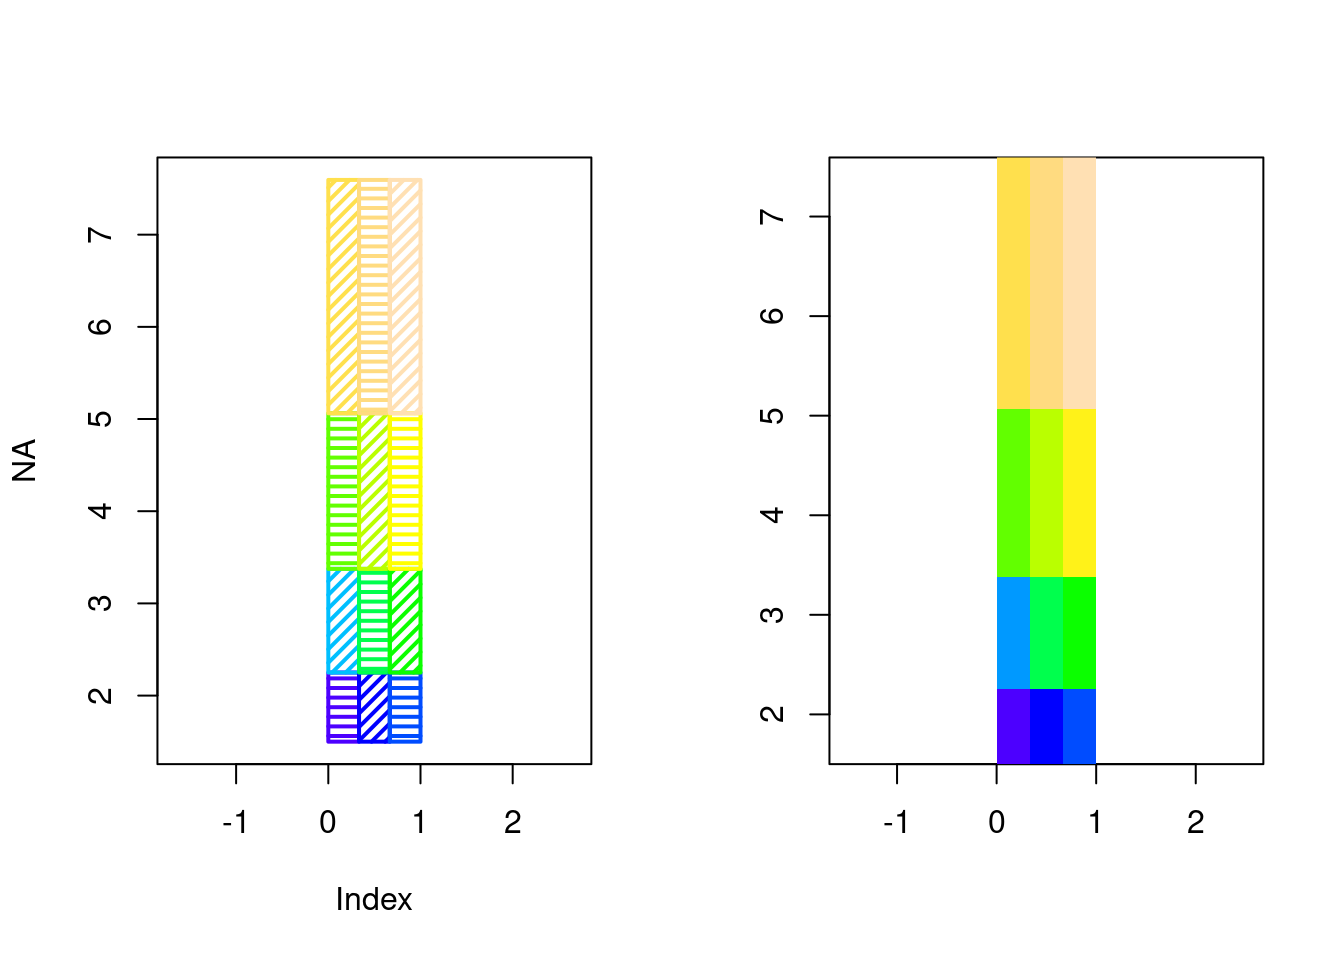
par(op)Relatively recently native image-graphics support was added to R.
Old style
m <- matrix(1:12, nrow = 3)
xcorner <- seq.int(0, 1, length.out = nrow(m) + 1L)
ycorner <- seq.int(0, 1, length.out = ncol(m) + 1L)
image(xcorner, ycorner, m, col = topo.colors(25))